
This post originally appeared on Riskified Technology Blog
“No single metric can measure the performance of computer systems on all applications. System performance varies enormously from one application domain to another. Each system is typically designed for a few problem domains and may be incapable of performing other tasks.”
Jim Gray, “The Benchmark Handbook for Database and Transaction Systems”, 1991.
Measuring system performance is hard – there are no magic bullets.
A design decision that you’ve made naively, like choosing the wrong instance type, may lead to degraded performance and even unavailability of your services later on as you scale. Something that’s not acceptable in today’s online world.
In his book from 1991, Jim Gray defines “how to choose the right system” perfectly – “The system that does the job with the lowest cost-of-ownership”.
Many companies only evaluate TCO (Total Cost of Ownership) when testing new products. They rely on their vendor benchmarks, which might be misleading (like network packets that are faster than the speed of light), or too broad (like AWS “up-to” magic phrase when dealing with network performance).
Despite the fact that there are many useful analysis reports, which are more focused on pushing distributed systems to their limits, like the famously known Jepsen, it is important to know your own custom deployment limiting factor as it might be different from one deployment to another.
Knowing how much your system can handle, how many RPS it can make and what the limiting factor is – the disk, network, memory or CPU can give your deployment a better framing, assist in preventive maintenance and help you guesstimate the impact of scaling out your system and eliminating toil.
Riskified’s Data Platform
Riskified’s Data Platform group is split into 3 teams – Data Offline, Data Apps, and the bridge between them – Data Streams. Each team is responsible for its own specific data domain.
Our main goal is to provide an efficient, robust and scalable data platform that is used by hundreds of Riskified employees in the various departments – Development, Data Engineering, BI, Data-Science, Research, Support & Integrations, and more.
As we continue to grow, the amount of data we process, store and analyze grows too, and the demand on our systems only gets higher as a result.
We aim to provide the highest SLA possible to our internal clients, allowing them to move fast and only focus on the thing that matters – the business logic itself.
With that in mind, and with plans to migrate into a new Kafka deployment that will allow us to move faster, we decided to apply the same method, and benchmark our clusters before migrating into them.
Setting the goals
We started to plan our cluster benchmark with a few key points in mind:
- No special tricks – the benchmark should test the exact same deployment and configuration as we planned to use on our new clusters
- Mimic our environment – the benchmark should run as a Riskified service from our K8S cluster, with the same resources that a real service would get
- It must measure the peak performance of the system when performing typical operations – in our case, producing and consuming from Kafka using the most commonly used client configurations
- Scalable – we need to have the ability to scale out and in the benchmark, to parallel tasks and to test different workloads on the same system as it evolves (i.e, adding more nodes and seeing the impact)
- Simple – the benchmark must be understandable, otherwise it will lack credibility
We defined a few key factors that are configurable by our clients and might affect the overall performance, and started to research what their most widely used values are.
We took into consideration our largest services (as our main internal clients) alongside the common values. Using that information, we created some kind of “Cartesian Product” with the different configuration combinations that we want to test against our cluster.
From our perspective, our baseline remains the performance of n-2, as we want to tolerate node failures and still be fully operational and keep the SLOs we defined as a team.
Having said that, we did test the final number of nodes that are going to be part of the new clusters.
We see this overhead-keeping as a best practice in our capacity planning.
What are the options?
After defining the goals and the tests suites, we started to evaluate the different options available for the task.
kafka-*-perf-test scripts
The most obvious first option was the built-in Kafka performance test tool. The tool allows you to measure, read and write throughput, stress test the cluster based on specific parameters, and more.
Apache JMeter
Apache JMeter is a veteran Apache project that can be used as a load testing tool for analyzing and measuring the performance of a variety of services.
Sangrenel
Sangrenel is a Kafka cluster load testing tool created by Jamie Alquiza (from DataDog). Sangrenel allows you to set the message and batch size, concurrency and other settings, and measure the message throughput, batch and write latency histograms.
OpenMessaging Benchmarks (OMB)
The OMB Framework is a suite of tools that make it easy to benchmark distributed messaging systems in the cloud.
Of all the available options, we decided to use the OpenMessaging Benchmarks tool.
The tool itself fulfills all the requirements and goals that we mentioned earlier, will be scalable enough and also will allow us to test other streaming platforms in the future, like Pulsar or NATS.
Define & build
As mentioned above, we wanted the benchmark to run as close to a real Riskified service as possible. That’s why we started by customizing the Helm chart, provided with the tool, to fit our environment and needs.
The OMB Framework is composed of two components – the driver and the workers.
The driver is responsible for assigning the tasks to the workers, creating the benchmark topic, creating the consumers and the producers, etc. Essentially it is the benchmark executor.
A benchmark worker listens to tasks to perform them. A worker ensemble communicates over HTTP.
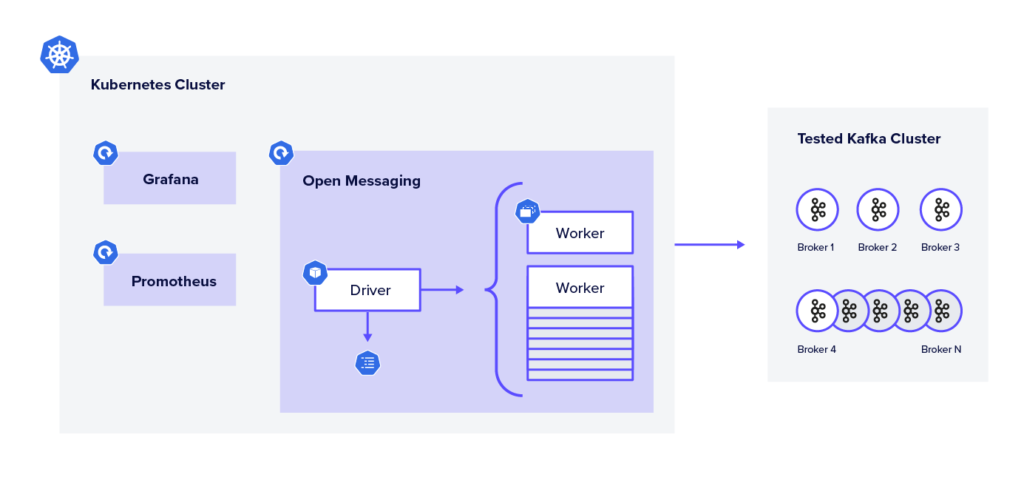
In our deployment, we created a single pod that acts as the Driver and a StatefulSet of workers with the amount of replicas that we want to test depending on the parallelism.
The driver is executed by getting 2 manifests:
- The drive configurations – contain all consumer and producer configurations (
acks,linger.ms, compression type, etc.) - The workload configuration – sets workload characteristics. including topic name, message size, partitions per topic, producer rate, and more
After the execution, the driver starts to produce warm-up traffic, and then the benchmarking traffic itself, while logging the current results – publishing rates, consuming rates, backlog, and end-to-end latencies. At the end of the execution stage, aggregated metrics will appear.
The aggregated test results can be stored as a CSV file for later data analysis, and the tool is packed with a Python script to visualize the test results in a graph.
Benchmark Insights
As we ran the different workloads, we were able to discover our deployment average latency. We noticed how more partitions or more workers affect the benchmark latency and the cluster load.
Other than the output of the tool itself, we also tracked the cluster behavior using our Grafana dashboards. Using those, we were able to see how our dashboard behaved in extreme circumstances.
We were able to discover our potential bottlenecks, in our case, the EBS drives who suffered from the high flush rate that the benchmark created, and reflected it with high IO times, and as a consequence – a spike in the end to end latencies.
With those results, we are now much more confident in our deployments. We know what could possibly go wrong, what our limiting factor is, and on what stage (RPS, MB/s, etc).
Given that information, we made sure that we have actionable alerts when getting closer to that limit. We now know how adding more machines can affect the cluster, and how we can plan accordingly for high traffic seasons.
We discovered that our deployment with our existing traffic only covers a small part of our cluster potential in terms of resources. We believe that with the current growth rate, the current deployment could take us a few more months before the need to scale.
Future work
The fact that we battle-tested our cluster not only gave us more confidence, it also affected our roadmap and allowed us to better plan our future deployments.
For instance, we now have concrete numbers on how switching to Zstandard compression can lead to lower resource utilization, and will allow us to “squeeze” more information on to the network bandwidth.
We now know that we will need to reevaluate our usage of EBS drives at some point – everything is a tradeoff.
Setting clear goals, choosing the right tool and investing in research and tests, lead us to insightful information and will allow us to use the same techniques in the future, as part of our routine and with other systems that we will want to evaluate.