💡 Quick Tip Post 💡
Usually, this blog contains long, deep-dive posts. This category will be different! This is a short and actionable post, which otherwise would go to /dev/null
Strimzi is awesome! In the last few years, it has made huge progress, becoming the go-to option to run the Kafka ecosystem on top of Kubernetes.
But as with every other JVM-based system, from time to time, we just need to use our old favourite tools like JConsole and Java Flight Recorder. When it comes to Kubernetes, it’s a bit more tricky.
In order to connect to a running Kafka Connect pods (running a Kafka Connect Connector or Debezium) with tools like JConsole, JMX Term, or Java FlightRecorder, we will need to expose the JMX ports locally and run a Kubernetes port-forward.
To do that, we will expose the JMX port, and override some of the parameters:
image: strimzi/kafka-connect:0.11.4-kafka-2.1.0
jmxOptions: {}
jvmOptions:
…
template:
   connectContainer:
      env:
      - name: KAFKA_OPTS
      value: -Dcom.sun.management.jmxremote.local.only=false -Djava.rmi.server.hostname=127.0.0.1
The important ones are jmxOptions and KAFKA_OPTS.
- We use
jmxOptions: {}to make sure we expose the JMX port without any auth. - The
KAFKA_OPTSparameter allows us to add some flags to the JVM. In this case, allowing connections from “outside”, and exposing it to localhost. The base config for JMX is configured on Strimzi startup scripts, which does not allow us to configure them to allow outside connections, thus, we need to make these changes as well.
Once we have it, you can use the tools to connect to the running pods using a simple kubectl port-forward:
Start JConsole
kubectl port-forward <strimzi_pod> 9999
jconsole -J-DsocksProxyHost=localhost -J-DsocksProxyPort=9999 service:jmx:rmi:///jndi/rmi://localhost:9999/jmxrmi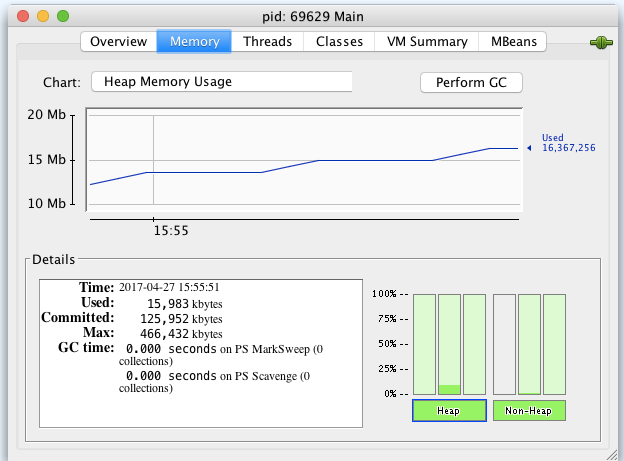
Start JMXTerm
If you are not familiar with JMXterm, go over Robin Moffatt‘s great post:
java -jar jmxterm-1.0.2-uber.jar --url localhost:9999Java Flight Recorder
JFR is a bit more tricky.
Once again, we need to edit our KafkaConnect object with:
jvmOptions:
  -XX:+UnlockDiagnosticVMOptions
  -XX:+DebugNonSafepoints
  -XX:+UnlockCommercialFeatures
  -XX:+FlightRecorder
  -XX:StartFlightRecording=filename=/tmp/recording.jfr,duration=60s
...
...
template:
  connectContainer:
    env:
      - name: KAFKA_OPTS
        value: "-Dcom.sun.management.jmxremote.local.only=false -Djava.rmi.server.hostname=127.0.0.1"
To start and stop the JFR sessions:
# start
kubectl exec -it <strimzi_pods> -- jcmd <pid> JFR.start name=myRecording filename=/tmp/recording.jfr duration=60s

# list
kubectl exec -it <strimzi_pods> -- jcmd <pid> JFR.check

# stop
kubectl exec -it <strimzi_pods> -- jcmd <pid> JFR.stop name=myRecording
Once we have the recording ready, we can use cp to retrieve it and analyse it locally:
kubectl cp <strimzi_pods>:/tmp/recording.jfr ./recording.jfr
jmc
From JMC, load the recording.jfr file and analyse the performance metrics.
Done! Happy debugging! 🙃